
Set up Debugpy Manually in VSCode
How to set up debugpy manually in VSCode

debugpy is the official Python debugger backend used by Visual Studio Code, PyCharm, and other modern IDEs.
It is a Python library that enables remote debugging, breakpoint handling, variable inspection, and stepping through code line by line — all features you'd expect in an IDE.
Today, I got some issue with it, it won’t run in certain code editor (VSCode Insider) but works in others (Cursor). After tweaking it for a while and didn’t find any solution, I discovered that it can actually be implemented manually instead of relying solely on the default setup. I’ll show you how:
Installation
First, install debugpy package using pip.
pip install debugpyDon’t forget to install debugpy addons on VSCode, go to Extensions and searh for debugpy.
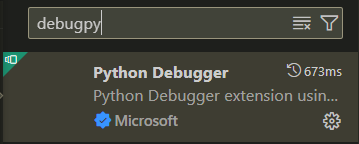
Select the Microsoft version and install it.
Run Debugpy
Then, run the app with debugpy with:
python -m debugpy --listen 5678 --wait-for-client your_script.pyBecause I’m running Odoo, this is my command:
python -m debugpy --listen 5678 --wait-for-client ./odoo-bin -c myconf.conf --dev all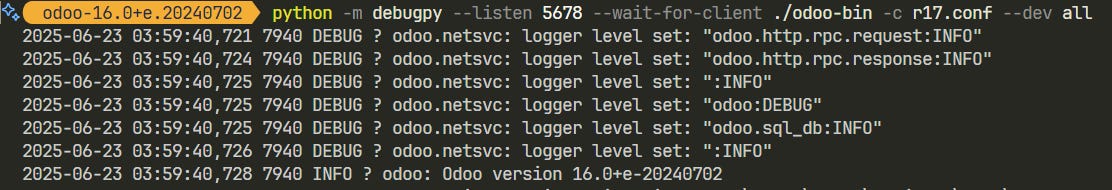
Then in VSCode create a new config:
{
  "name": "Attach to Odoo",
  "type": "debugpy",
  "request": "attach",
  "connect": {
    "host": "localhost",
    "port": 5678
  },
  "justMyCode": false
}
Run the VSCode debugger with F5 and select “Attach to Odoo” or any name that you have defined.
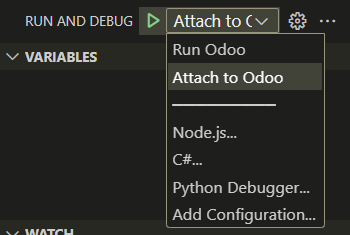
It will listen to debugpy and you can use it like usual to debug your Python app.